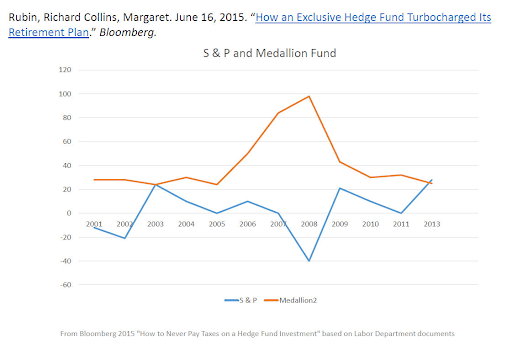
The random walk model is the first attempt to describe the stochastic behavior of securities prices, following the Bachelier theory that led to the concepts of modern analysis (martingale, risk-neutral measures…) but of course, it has some weaknesses. Nowadays the focus on the right mathematical modeling of the evolution of financial instruments’ values is the key to invest efficiently. Renaissance Technologies and its most profitable portfolio (Medallion Fund) is the case that every quant is paying attention to. The mathematical models used by this fund are extremely complex and innovative, and they aim to find gainful correlations in markets: from 2001 through 2013, the fund’s worst year was a 21 percent gain, after subtracting fees. Medallion reaped a 98.2 percent gain in 2008, the year the Standard & Poor’s 500 Index lost 38.5 percent.
From the pioneering work of Louis Jean Baptist Bachelier, The Theory of Speculation of 1900, modern finance began to take shape. The French mathematician used a well-known physical phenomenon, the Brownian motion as a model to analyze the evolution of prices on the stock markets.
Description of the Brownian motion
Bachelier’s thesis entitled ‘’Théorie de la Spéculation’’ had the aim of developing formulas to determine the price of complex derivative instruments. To do this, it was necessary to understand how the share prices at the base of these instruments vary. The author specified in the introduction of his research that :
“The determination of these activities depends on an infinite number of factors: therefore one cannot absolutely hope to be able to formulate a (exact) mathematical forecast”
Louis Bachelier
Bachelier’s fundamental idea to estimate the probability of price changes began with considering the bond market as a balanced game. To understand this concept, you can imagine a possible game between a croupier and a player. The croupier flips an unpainted coin N times. When head appears, the player wins 1 euro, vice versa, when cross appears he loses 1 euro. At each throw, both head and cross have the same chance to show up. Each throw is therefore independent of the previous one, i.e. first throw has no implication on the second throw.
In simple words, Bachelier’s main idea is that money, from a probabilistic point of view, after a long series of launches should bring a zero profit.
Random Walk
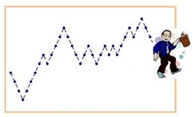
In the mental experiment of the balanced game with the coin, the result is tracked (+ 1, -1) for each toss. This accomplishes what in mathematics is called a stochastic or random process, also called a random walk. This term was first introduced in 1905 by the statistician Karl Pearson, who illustrated the problem using the metaphor of the drunken man walking staggering in an open field. The man, staggering during his journey will take a few steps in one direction, then in another and so on. After a while, if you want to look for the drunk man where should you look? The most probable place to find the man is right near his starting point.
Like money, this mental experiment can describe the random path of a particle that can move in any direction with the same probability. In the same way, it can describe the fluctuations in the share price, which performs a series of random movements. The price may go up or down but on average it will fluctuate around the starting point. Bachelier started from these fundamental concepts for the construction of his model.
According to the model, the change in prices cannot be traced back to any sequential correlation, but on the contrary, they are to be considered random. Therefore, according to the theory, the past price trend cannot be a reliable indicator to predict the direction of the fluctuations in the future. This theory bases its assumptions on the hypothesis of market efficiency, which presupposes a high transparency of the financial news concerning the companies, which thus become accessible to most investors. According to this hypothesis, therefore, the current price of a company represents a good estimate of its intrinsic value and, any differences between these two parameters are to be charged exclusively to facts and news concerning the title itself. Since these factors alternate in an irregular way, it follows that the prices also describe a succession of completely irregular and independent data. Ultimately, the Random Walk theory denies the existence of trends and regards any prediction based on statistical-mathematical models or on the observation of graphs as unreliable.
Limits of Bachelier’s thought
Bachelier’s revolutionary theory also has several limitations. In fact, in using the random walk to describe the price path of a security it is possible, by the very nature of the process, that it exceeds the zero threshold, thus generating negative numbers for prices, which in the real world cannot happen. After the economist Paul Samuelson in 1960 rediscovered the work of the French mathematician, Bachelier’s theory was revised on the assumption that it is not so much the change in price that affects, but the proportional change in price. This problem, mathematically, can be managed with the logarithm.
In addition to the fact that prices do not move by one unit, a further difference between the Bachelier model and real finance is that markets move continuously. Time ranges over the entire line of positive real numbers, and not in discrete-time where instead it takes value in the set of natural numbers (t = 0, 1, 2, 3, and so on), as in the example of money. Bachelier devised an important theory for the transition from discrete to continuous time. Unfortunately, he never made it rigorous, due to the lack of the necessary mathematical tools.
The mathematical point of view
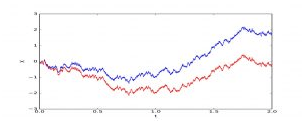
In 1923 Norbert Wiener produced a rigorous mathematical construction of Bachelier’s theory, directly in continuous time, based on the process of Brownian motion. Mathematically, a Brownian motion is described by what is called the Wiener process, which is a stochastic process indexed by continuous time. For simplicity of treatment, we will consider as initial time instant t = 0.
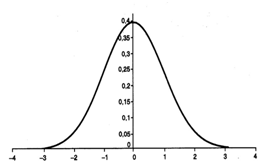
Brownian motion has some relevant properties. The increments described in the Wiener process, for example, are independent and are normally distributed. The probability distribution, in statistics, is a function that shows the possible values for a variable and how often they occur. The most famous and used distribution is precisely the normal distribution, expressed by the Gauss curve, used to explain many natural and economic phenomena. If the values follow this curve, which takes the shape of a bell, in practice, you will hardly ever find a case that deviates much from the average. This probability distribution can describe variables such as the height of a population, the IQ test scores or, returning to Bachelier, the earnings by playing heads or tails.
As Bachelier guessed, if all the price changes of a bond relating to a certain period are arranged in a diagram, these are arranged in the usual form of a bell curve.
Forerunner of revolutionary ideas
In 1965, Eugene Fama, taking inspiration from Bachelier’s considerations, formulated the so-called Efficient Market Hypothesis, thus providing the basis on which modern financial theory rests. According to Bachelier, price fluctuations were mostly caused by irrational factors, which overall cancel out symmetrically generating zero profit expectations. Rather, Fama attributed randomness to efficient Markets, in which competition between completely rational participants leads to a situation in which the prices of individual securities, at any moment in time, already reflect the effects of information about events that have occurred and will happen.
In an efficient market, at any time, the actual price of the security will be an estimate of its intrinsic value. The Fama version does not differ from the result of Bachelier’s casual walk, but deduces a more compelling characteristic: the markets are impossible to predict not because they are irrational but because they already incorporate all the available information. This model starts with the finding of the imperfect linearity between return and risk measured by the beta and is based on the multifactorial approach. In particular, this model adds two fundamental risk indicators to the beta coefficient of the CAPM: the size of the company and the reciprocal of the multiple P / BV (Price/Book Value).
Although there might be an inverse relationship between size, measured by market value or market capitalization, and equity returns, this trend is not accompanied by the increase (or decrease) in the beta. As a general rule, the securities of a larger company should be less risky and therefore less profitable. In contrast, the securities of smaller companies should compute a higher risk and a higher yield. This would induce the investor to request a higher premium to offset the additional risk. The relationship between book value and market value also has a high explanatory power: a high value of the ratio (P / BV low) distinguishes securities with low growth prospects and therefore less risky; securities that show a low value of the indicator in question (P / BV high) denote good growth prospects and high intangible assets that are reflected in the market value rather than the book value.
In fact, for both cases, size and book to market value, Fama and French find that the empirical evidence is very different from the theoretical statement and that the risk premiums do not depend solely and exclusively on the systematic risk, measured by the beta, but on the contrary, they show a greater sensitivity towards the performance of the three factors considered together.
Renaissance Technologies, the hedge fund of scientists
Renaissance Technologies is the famous hedge fund that has recorded record performances since the 1980s. Renaissance is considered by many to be “the largest money machine in the history of finance”, since its main fund, Medallion, has earned an average of 40% per year since its inception, already net of expenses: an incredible return even for a hedge fund. To make a comparison, just think that, in the same period, the Standard & Poor 500 index (S&P500) gained 10%, and Warren Buffett’s holding Berkshire Hathaway only 16%.
It naturally arises to ask what differentiates this fund from all the others and what makes it so performing. The answer is that the success of this fund is essentially due to the brilliant mind of its founder, James Simons, a world-renowned mathematician.
Simons showed exceptional talents from a young age, graduating at the age of twenty at MIT in Mathematics and Literature, and obtaining a Ph.D. in Berkeley in 1962. Even before finishing his PhD he was appointed professor of Mathematics at the University of Lancaster and became one of the main cryptographers and coders at the Institute of Defense Analysis until he resigned due to divergent opinions on the Vietnam War.
For this reason, he returned to academia, being appointed dean of the Department of Mathematics at Stony Brook University at the age of thirty. As evidence of his skills, in 1976 he won the Oswald Veblen Prize for a work in the field of geometry that allowed to demonstrate the validity of Bernstein’s conjecture up to the eighth dimension. However, in 1978, Simons decided to leave the university world to devote himself to the creation of an investment fund that was essentially based on the use of financial mathematics. In 1982 Renaissance Technologies was born.
Renaissance strategy.
The fund uses systematic trading based on complex mathematical models. The models used are still a mystery and are the subject of numerous speculations. From Simons’ declarations, it appears that the fund is based on computerized systems that analyze all the data that can be collected, even of a non-financial nature, in search of non-random movements and possible patterns.
For this reason, one of the peculiarities of the fund is that the majority of employees have a non-financial background. More than 90% of employees have scientific qualifications, having a Ph.D. in computer science, mathematics, physics, astrophysics, and statistics. The CEO, Peter Brown, is a mathematician with a Ph.D. in computer science, like almost all the key figures in the fund.
Simons’ early collaborators were computer scientists who were working on IBM’s artificial intelligence program and contributed to the development of the first successful algorithm. Thanks to machine learning, Renaissance developed algorithms capable to predict price changes and making accurate predictions through time series.
The success of the fund also depends on the almost zero turnover: thanks to the bonuses and incentives given to employees, very few of them leave their jobs and this is also why the secrets of its algorithm have not yet been revealed. The poor declarations of the executives and the isolated location highly protected by security systems also contribute to the maintenance of the lucky secret, fueling the legend and speculation on the bottom.
Many believe that the fund has developed a model with numerous deterministic components, in which the stochastic and random components appear only residually: if true, this model would be the “philosopher’s stone” of speculative funds.
Sources :
- “Theory of speculation” – Louis Bachelier
- “Louis Bachelier Theory of speculation” – Mark H. A. Davis – Imperial college
- “The man who solved the market” – Gregory Zuckerman

